Windsor-Essex Real Estate Market Insights
The Windsor-Essex housing market is constantly evolving - and understanding the latest real estate trends helps buyers and sellers make smarter decisions.
At NextGen Real Estate Group, Century 21 Local Home Team Realty, we track real-time statistics, pricing trends, and local inventory to give our clients a clear view of what’s happening in today’s market.
Whether you’re buying, selling, or investing, this page is your go-to resource for local market insights and expert commentary.
Current Market Snapshot
The Windsor-Essex real estate market moves fast.
Here’s what we monitor every month:
Average Sale Price: How values are trending across neighborhoods.
New Listings: Supply entering the market.
Months of Inventory (MOI): The balance between buyers and sellers.
Days on Market: How long homes are taking to sell.
Sale-to-List Ratio: What percentage of asking price sellers are receiving.
These stats are updated monthly using data from the Windsor-Essex County Association of REALTORS® (WECAR) and our in-house market tracker.
Monthly Market Report: October 2025
Quick Highlights:
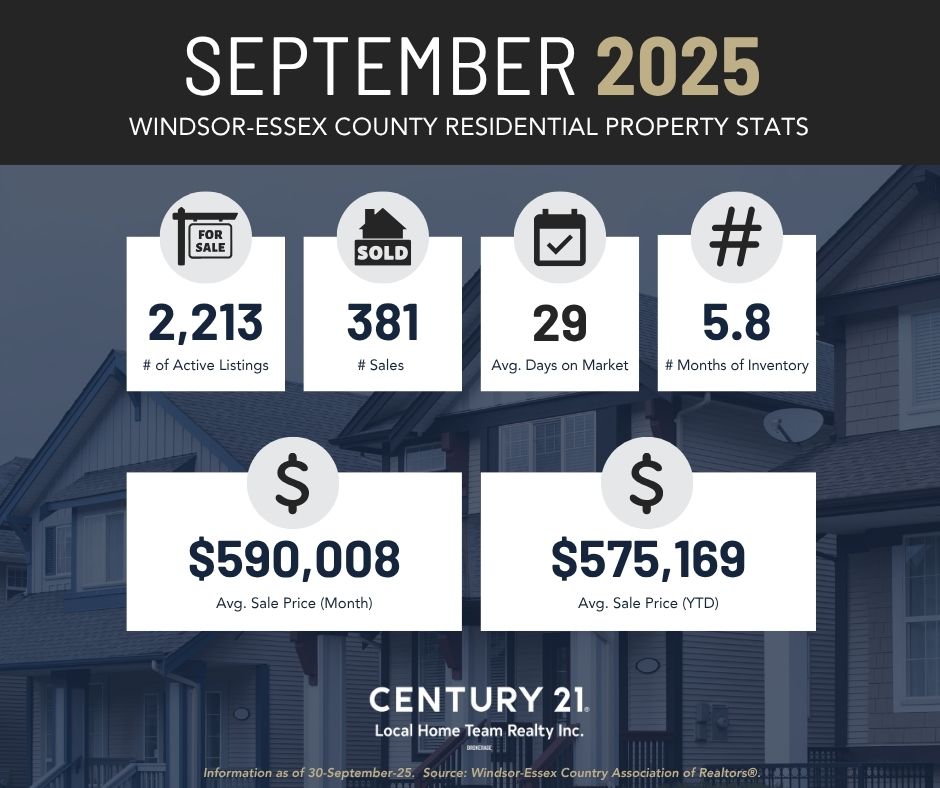
Average Home Price: $590,008
Months of Inventory (MOI): 5.8 months
Sales-to-New Listings Ratio: 30.2%
Year-over-Year Price Change: +1.60%
Our team analyzes this data weekly to help clients price, purchase, and plan strategically.
Want the full report?
Request Your Personalized Home Equity Report

These Windsor-Essex market stats are sourced from WECAR and analyzed by NextGen Real Estate Group to identify key shifts in pricing and demand.
Market Interpretation
Numbers matter - but context matters more.
Our team studies patterns that shape local pricing and buyer behavior:
How interest rate changes affect Windsor-Essex demand.
The impact of new construction and supply trends.
How neighborhood-level data (like LaSalle and Lakeshore) differ from Windsor proper.
Where opportunities exist for both move-up buyers and investors.
Each month, we publish a brief “NextGen Market Minute” on our social channels and newsletter. Follow along for real-time updates.
Windsor-Essex Market by Area
The region’s diversity means prices and timelines can vary significantly by community.
Quick Links:
Compare average home prices, days on market, and sale trends by community on each page above.
Tools for Homeowners & Sellers
Want to see how market changes impact your home’s value?
Use our free tools and resources:
Home Equity Report – monthly home value insights
Seller’s Guide – proven strategy for listing success
Buyer’s Guide – full roadmap for purchasing in Windsor-Essex
Our Expert Take
“Data tells the story of what’s happening but local experience tells you what it means.
We use both to help our clients buy and sell with confidence.”
NextGen Real Estate Group, Century 21 Local Home Team Realty
Windsor Essex Real Estate Market Insights FAQs
MOI measures how long it would take for all active listings to sell at the current pace of sales.
-
Under 4 months: Seller’s market
-
4–6 months: Balanced market
-
Over 6 months: Buyer’s market
In September 2025, Windsor-Essex sat at around 5.8 months, indicating a balanced environment.
Because each month’s mix of homes changes - one period might include more luxury sales, another more condos or townhomes.
That’s why we also track year-to-date averages and median prices for a clearer long-term view.
Interest rates, job growth, and population trends are the biggest drivers.
Proximity to the U.S. border and ongoing infrastructure projects also influence local buyer activity.
We monitor these factors closely to help clients time their moves strategically.
As of fall 2025, the market is balanced - not crashing, not overheated.
Inventory has increased, giving buyers more choice, while sellers still achieve strong prices on well-marketed listings.
Right here on our Market Insights page.
Each month, we post a full NextGen Market Minute with updated stats, trends, and local analysis.
You can also subscribe to receive updates directly through our Home Equity Report program.

